NASDAQ Carves Potential Top At 11071
17 July 2020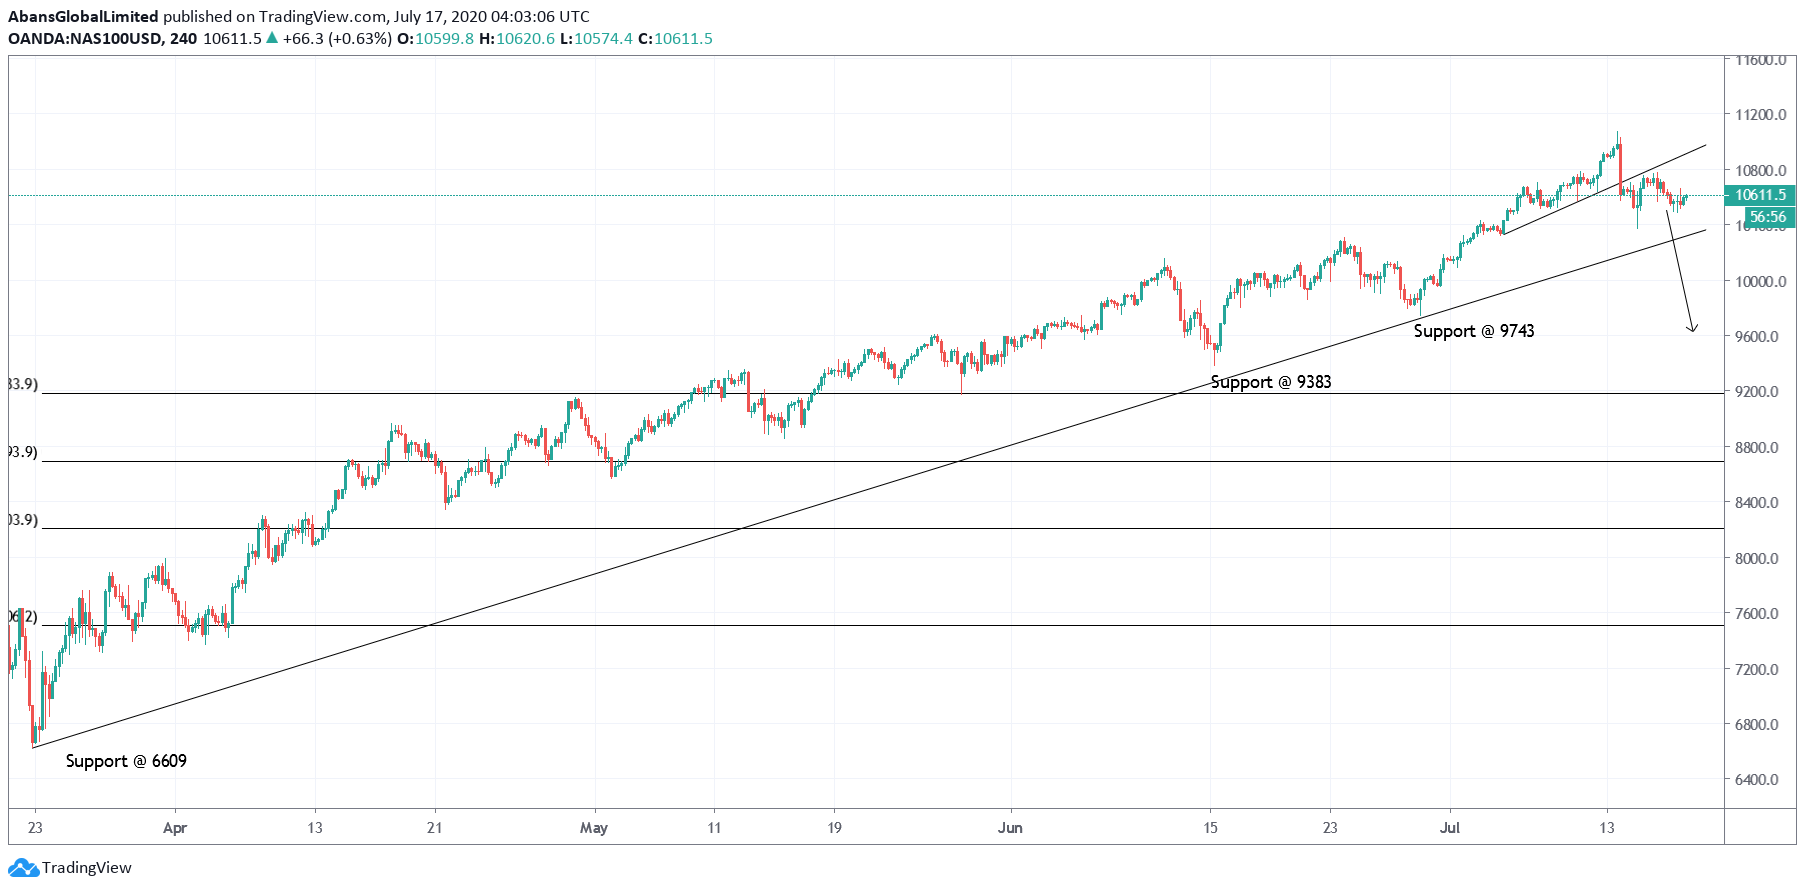
NASDAQ might have carved a meaningful top at 11071 on July 13, 2020. It cannot be predicted with certainty but the indice has at least broken below its immediate line of support as presented on the 4H chart here.
NASDAQ remains in the sell zone of the immediate support trend line while it is in the buy zone of the outer support trend line. A break below the outer trend line will confirm a potential bearish reversal ahead. Immediate resistance lies just above 10800 mark.
NASDAQ had produced a religious up trend since March 22, 2020 lows around 6400/10. The indice has nearly doubled in value as it hit 11071 mark early this week. For the first time in the last 15 weeks, the indice has broken below a support trend line.
It could be seen as a potential bearish reversal if prices hold below 11071 resistance, going further. Immediate price support is seen towards 9743, followed by 9383; while resistance is intact around 11071 levels respectively.
A break below 9743 support would be considered as the first step towards a potential bearish reversal. Bears can prepare to sell on rallies thereafter, allowing the indice to retrace. Until the above proposed structure unfolds, it is safe to stay flat.
Looking at the lower degree wave structure, bears might have been successful in carving wave 1 between 11071 and 10372 respectively. A potential Wave 2 could be underway and might terminate around 10800/50 mark.
If the above holds well, NASDAQ would remain below 11071 levels and continue lower towards 9743 going further.
Prepared by
Technical Analysis Team
Trade with
Abans Global
- Authorised and Regulated by FCA
- Customer Support 24/5
- Low Spread & Commission
- Instant Execution
- No Dealing Desk