Gold Might Pullback Towards $1950/90
28 September 2020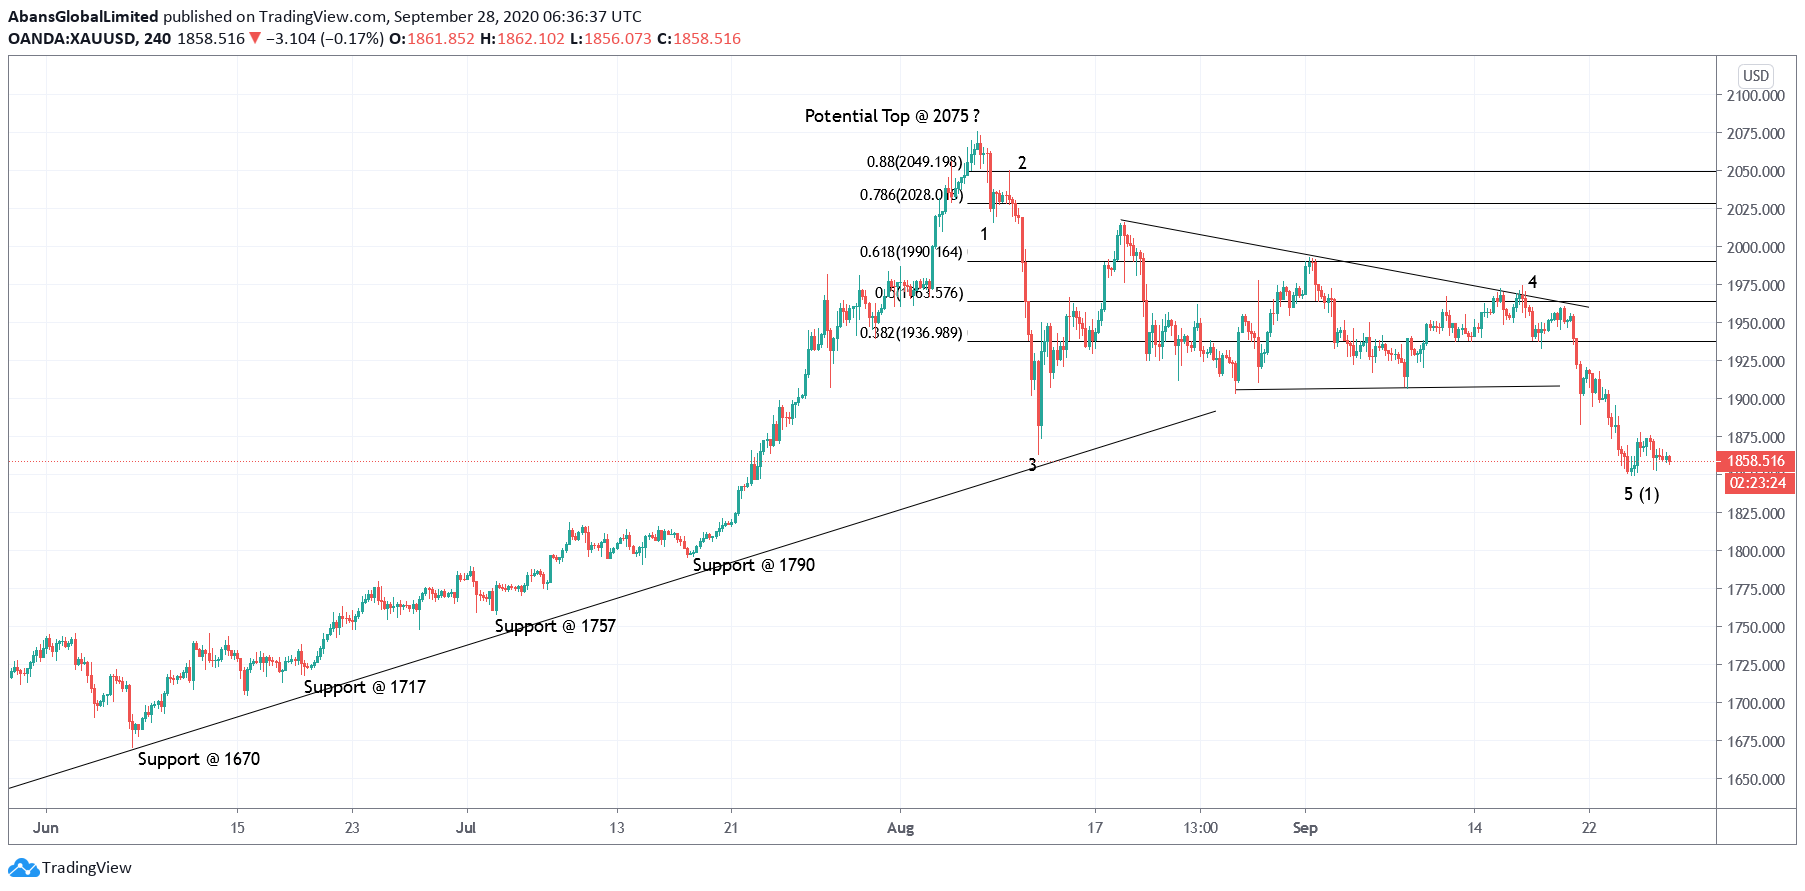
Gold has confirmed that bears are in control and the long term trend might have turned lower after prices broke below $1862 lows over the last week. The yellow metal trades close to $1860 levels for now and might be preparing for a counter trend rally soon.
Gold short term wave structure since $2075 highs is as follows: The drop from $2075 towards $2015 could be marked as lower degree Wave 1. The subsequent rally towards $2050 as Wave 2 and the drop thereafter towards $1862 as Wave 3 respectively.
Gold remained sideways for an extended period after printing $1862 lows, and managed to produce a contracting triangle. The triangle terminated around $1975 levels, which could be potential Wave 4 as labelled on the chart here.
Finally, Wave 5 might have terminated around $1848 levels completing the impulse drop from $2075 mark. If the above structure holds well, we could witness a strong corrective wave towards $1950/90 levels under ideal conditions.
Also note that Wave 4 termination was seen towards $1975 and fibonacci 0.618 retracement is seen through $1990 levels respectively. High probability remains for a bearish resumption, if prices manage to reach there in the next few trading sessions.
Traders might be prepared to initiate fresh short positions around $1950/90 zone, with protective stop above $2075 and projected target below $1670 levels.
Prepared by
Technical Analysis Team
Trade with
Abans Global
- Authorised and Regulated by FCA
- Customer Support 24/5
- Low Spread & Commission
- Instant Execution
- No Dealing Desk