Dow Jones Carves Potential Top Around 28154
12 August 2020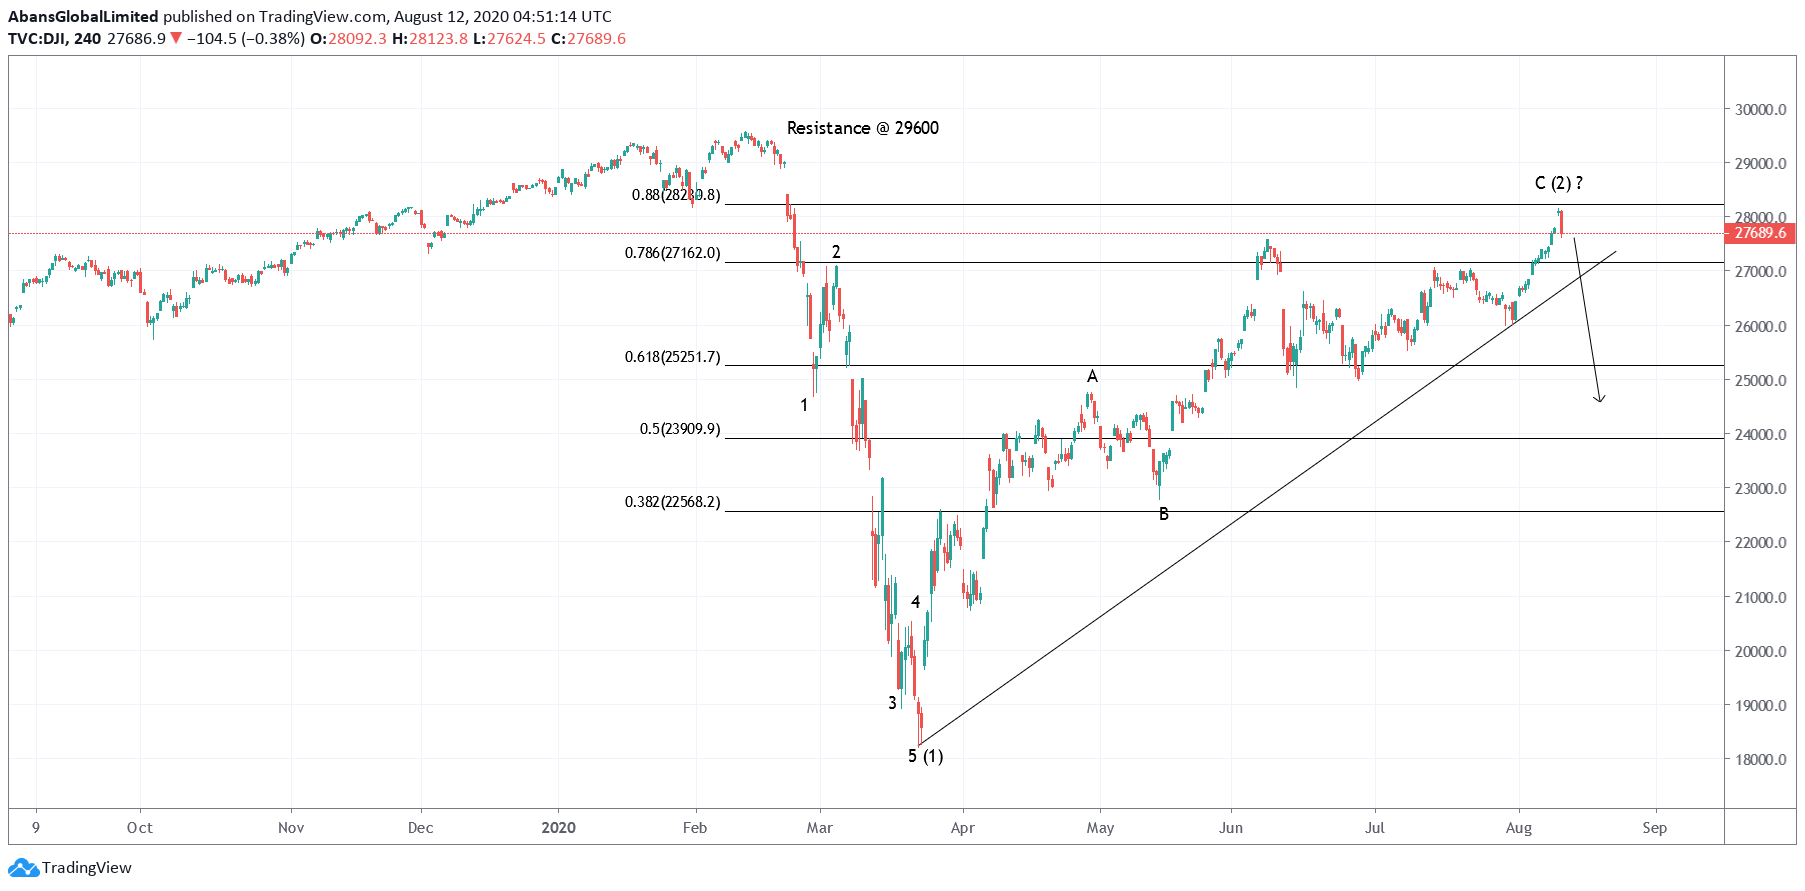
Dow Jones seem to have finally carved a potential top yesterday around 28150 levels in the cash segment. The indice had reversed sharply and closed lower around 27686, carving a potential reversal pattern on the daily chart view.
Dow Jones probable wave counts are as follows: The indice had already carved a larger degree impulse drop between 29600 through 18200 levels in February-March 2020. This drop has been marked as Wave (1) on the daily chart here.
An impulse drop should be ideally followed by a corrective rally. Dow Jones has been rallying since 18200 lows in March, and has managed to produce a potential zigzag towards 28150 levels yesterday. The corrective wave has been labelled as A-B-C, with termination as potential Wave (2).
If the above proposed structure holds well, Dow Jones should ideally stay below 28150 mark and continue lower from here. Immediate support is seen towards 26000, while resistance is seen at 29600 respectively. A break below 26000 will add further confidence to the bearish setup.
Also note that Wave (2) has travelled up to the fibonacci 0.88 retracement level around 28150 mark. This is also a typical Wave (2) guideline which allows a deep retracement before reversing lower again. If the above structure holds, Dow Jones should turn lower towards 18200 levels over the medium to long term.
Traders might be willing to initiate fresh short positions, with protective stop above 29600 and projected targets below 18200 over the next several weeks and months.
Prepared by
Technical Analysis Team
Trade with
Abans Global
- Authorised and Regulated by FCA
- Customer Support 24/5
- Low Spread & Commission
- Instant Execution
- No Dealing Desk